JUNE 24, 2025
A Practical Guide to Vibration Analysis Techniques
AKASH SHRIVASTAVA, PDM DATA SCIENTIST @ PETASENSE
Introduction
Vibration analysis is a core technique in condition monitoring and a critical part of predictive maintenance. It enables early detection of faults in rotating equipment, such as unbalance, misalignment, and bearing wear, before they result in costly failures.
Online vibration monitoring systems include several tools that simplify fault detection and diagnosis. These typically include trend charts to track long-term changes, time-waveform analysis to examine raw signals, and spectrum analysis to identify fault-specific frequencies. Additional techniques like demodulation (envelope) and cepstrum analysis help detect early-stage faults and complex modulation effects that may be missed using standard spectrum analysis.
Petasense ARO software brings these tools together in an intuitive platform, enabling users to interpret vibration data efficiently, prioritize maintenance, and improve asset performance. This article outlines each technique, its role in fault detection, and how it is implemented in Petasense ARO.
| Technique | Description | Usage & Applications | Key Features |
|---|---|---|---|
| Trend Charts | Visual display of how key vibration parameters change over time | • Detect developing faults • Validate effectiveness of maintenance • Monitor operating condition trends | • Triaxial broadband metrics (RMS, peak) • Narrowband feature tracking • Speed-based filtering • Customizable trend views |
| Time-Waveform Analysis | Direct view of raw vibration signal over time | • Analyze low-speed machine behavior • Assess data quality • Identify non-stationary signals (e.g., during startup or shutdown) | • Waveform visualization • Amplitude and shape insights • Detection of transients and modulation |
| Spectrum Analysis (FFT) | Converts time-domain signal into frequency domain using FFT | • Identify characteristic fault frequencies • Diagnose common faults such as unbalance, misalignment, and bearing issues | • Harmonic and sideband cursors • Forcing frequency markers • Envelope alarms |
| Waterfall chart | Series of spectra stacked over time to show trends in frequency patterns | • Monitor spectral changes over time • Detect resonance conditions • Visualize progression of fault frequencies | • Frequency trending over time • Selectable frequency tracking • Speed filtering |
| Demodulation (Envelope) Analysis | Extracts and amplifies high-frequency signals caused by impacts and defects | • Detect early-stage bearing and gear faults • Identify localized defects and high-frequency impacts | • Band-pass filtering • Signal rectification • Extraction of modulating frequencies |
| Cepstrum Analysis | Identifies periodic modulation patterns in the frequency spectrum | • Diagnose gearbox faults and complex modulation • Highlight repeated sidebands or modulation effects | • Inverse FFT of logarithmic power spectrum • Quefrency domain visualization |
Trend Charts
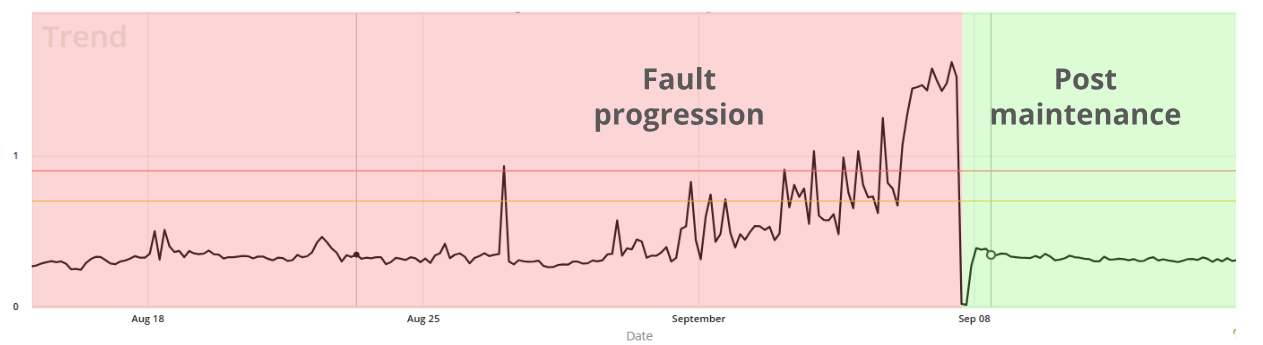
Trend charts provide a visual representation of how vibration parameters change over time, helping analysts track deviations from normal machine behavior. They are commonly used to detect developing faults and validate the effectiveness of maintenance or repairs.
By monitoring long-term trends in overall vibration levels, users can spot early signs of potential issues. Because vibration levels naturally vary with load and speed, it’s important to compare data recorded under similar operating conditions. Incorporating additional parameters, such as temperature, pressure, or motor current, can provide a more holistic view of asset health and help contextualize changes in vibration trends.
Trend charts in Petasense ARO can track both broadband and narrowband parameters:
Broadband trends focus on overall vibration severity, using metrics like RMS and peak values for acceleration and velocity, measured in all three axes (triaxial)
Narrowband trends focus on specific frequency components or frequency ranges extracted from the spectrum, such as 1X and 2X amplitudes.
Users can configure alarms based on baselines or custom thresholds, so significant changes trigger notifications for further investigation.
Petasense ARO also offers advanced charting features to support more precise and meaningful analysis:
Speed-based filtering: Filter trend data to include only values recorded within a specified speed range, ensuring apples-to-apples comparisons.
Custom trend charts: Combine multiple parameters, such as speed, magnetic flux, and vibration, into a single chart for a more holistic view of machine behavior.
Time-Waveform Analysis
Time-waveform analysis involves examining the raw vibration signal captured by sensors, showing exactly how a machine vibrates over time. While spectrum analysis is commonly used for fault detection and diagnosis, time waveforms offer complementary insights and, in some cases, can improve diagnostic accuracy. They are especially useful for understanding machine behavior in scenarios with non-stationary signals or complex faults that may not be easily detected in the frequency domain.
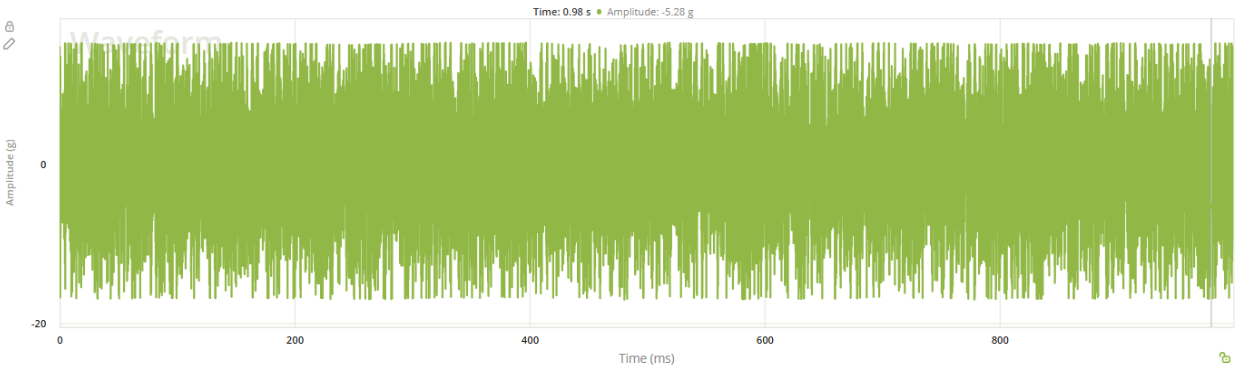
Waveforms can vary significantly depending on the source of vibration. Simple issues like unbalance often produce clean, periodic waveforms with regular patterns. But when multiple faults are present, the waveform becomes more complex due to the overlapping effects of different vibration sources. Depending on the fault type, a waveform may appear periodic, showing a repeating pattern, or random, with no clear repetition. Each type of fault tends to produce a distinct waveform signature, making time-waveform analysis a valuable tool for identifying specific issues. Below are some common examples of waveform patterns.
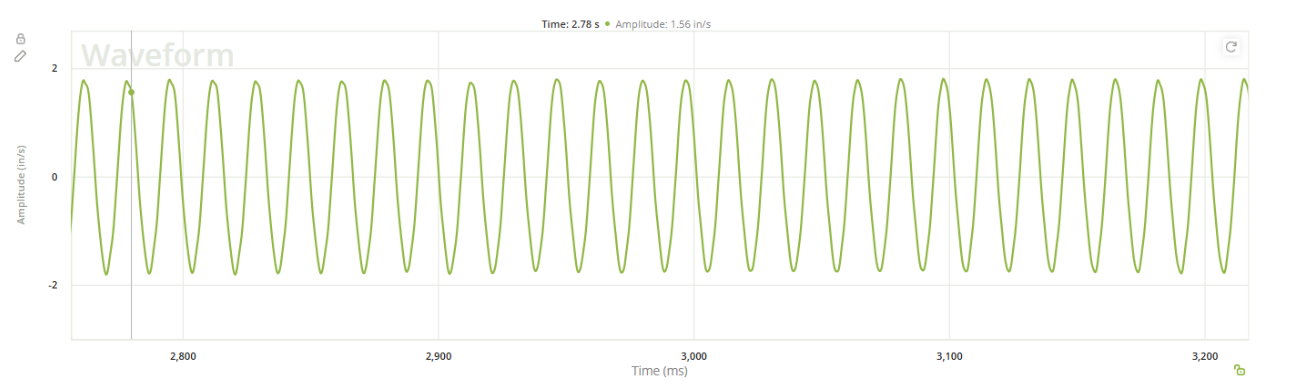
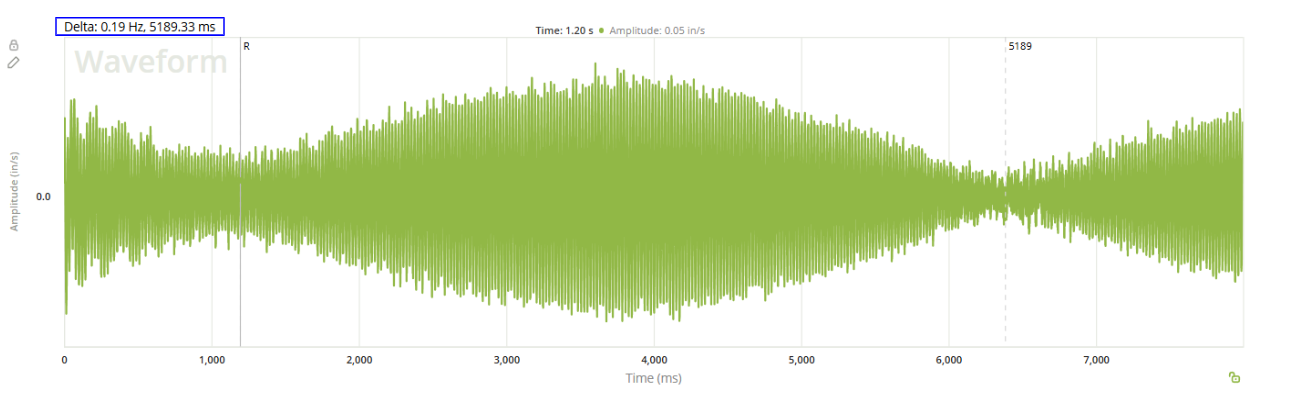
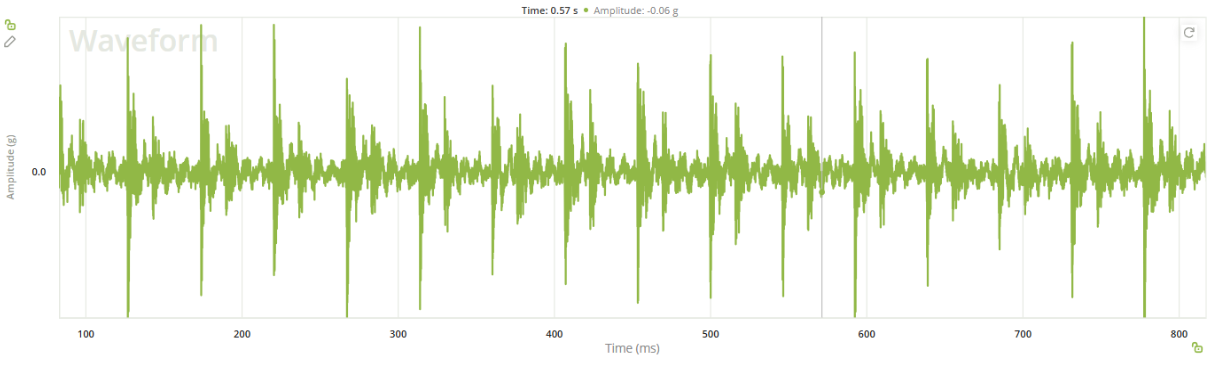
Two key characteristics of a vibration waveform are its amplitude and shape. Amplitude reflects the severity of vibration where higher amplitudes typically indicate more serious fault conditions. Waveform shape, on the other hand, can reveal phenomena like beating, modulation, or transient events. Modulation often points to issues such as gear or bearing defects, where amplitude varies periodically. Transients, seen as sudden spikes in the waveform, may suggest impact events or other irregular conditions.
Time-waveform analysis also plays a critical role in assessing data quality. It can reveal sensor issues like clipping, caused by sensor overload, where the waveform appears “cut off” at the peaks. Transient disturbances, such as electrical noise or external shocks, are often easier to detect in the time domain than in the frequency domain. By closely examining the waveform, analysts can verify that the data used for condition monitoring and fault diagnosis is both reliable and accurate.
Spectrum Analysis
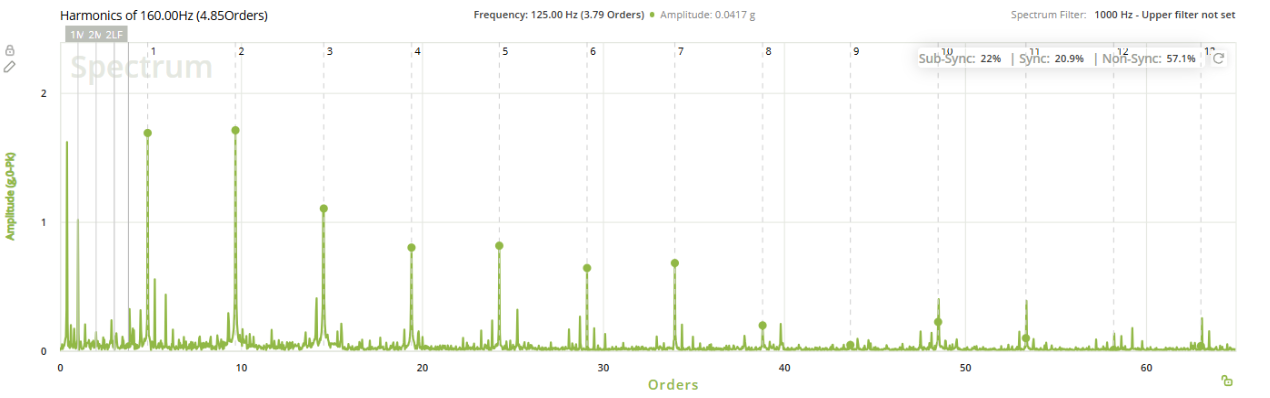
Spectrum analysis is a fundamental technique in vibration diagnostics, used to identify and interpret fault conditions based on frequency patterns. Since distinct faults produce unique spectral signatures, converting vibration signals from the time domain to the frequency domain helps reveal characteristic fault frequencies, making it easier to pinpoint specific machine issues. For example, unbalance typically appears as a dominant peak at running speed, while bearing defects generate distinct frequency patterns based on rolling element interactions. Below are examples of spectrum patterns associated with different fault conditions.
When vibration data is recorded, it contains a range of frequency components that help assess a machine’s condition. These frequencies, excluding noise, can be grouped into two categories: generated (or forcing) frequencies and excited frequencies. Generated frequencies include inherent machine-specific signals, such as rotor bar pass frequency in an electric motor, as well as fault-induced frequencies like those caused by gear defects. Excited frequencies, on the other hand, are the machine’s natural resonances or structural frequencies that are triggered by internal or external forces.
While vibration is the most commonly analyzed parameter in spectrum analysis, thanks to its sensitivity to a wide range of mechanical faults, this technique can also be applied to other signals, such as audio and motor current. Incorporating multiple signal types into spectrum analysis can improve the accuracy of fault detection and diagnosis.
Triaxial vibration data (axial, radial, and tangential) is also valuable for diagnosing faults, as it allows analysts to detect patterns and amplitudes in different directions. For example, angular misalignment often produces high 1x (shaft speed) vibration in the axial direction.
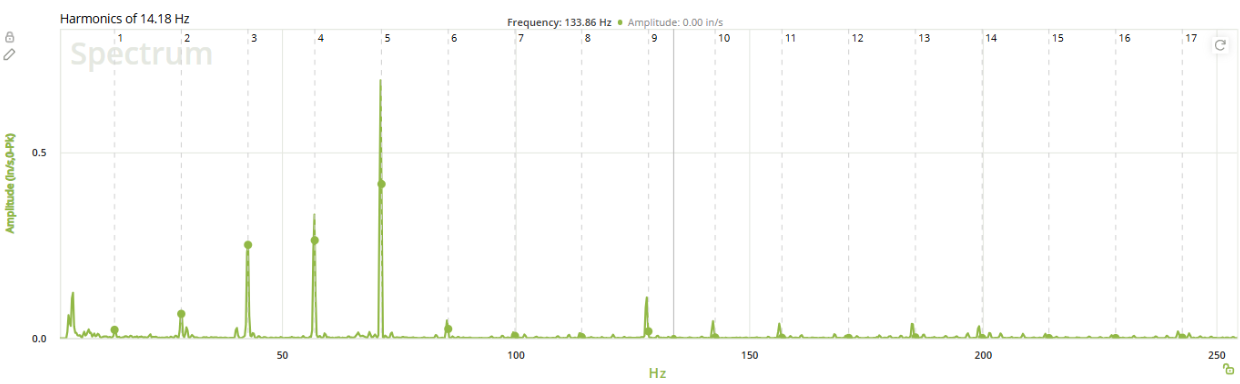
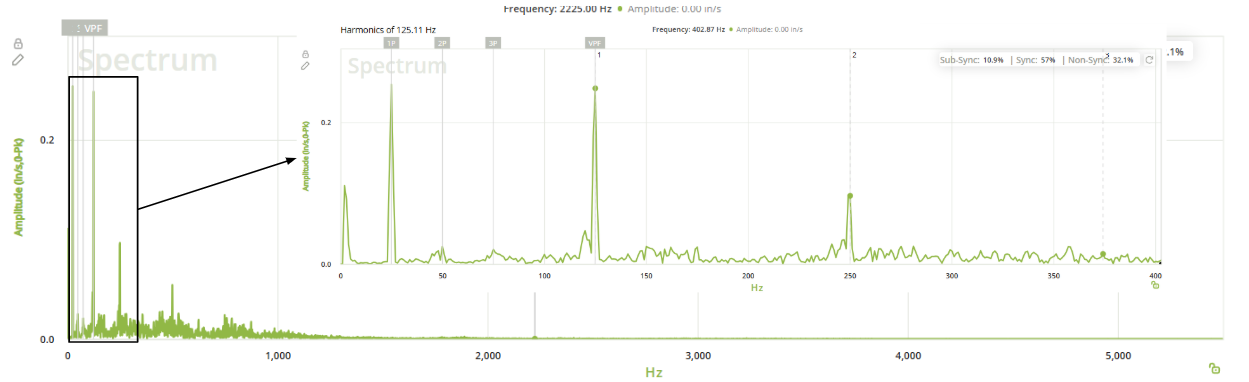
In the Petasense ARO platform, a range of tools are available for spectrum analysis including harmonic cursors, sideband cursors, and forcing frequency markers. These features help users identify and compare key frequencies and improve the accuracy of fault diagnosis.
Waterfall Charts
Waterfall charts offer a three-dimensional view of vibration spectra, allowing analysts to visualize how frequency patterns change over time. Unlike traditional spectral analysis, which captures a single point in time, waterfall charts stack multiple spectra sequentially, based on the selected duration and number of samples.
This visualization is especially useful for tracking the progression of faults such as unbalance, misalignment, bearing wear, and gear damage. For example, a growing amplitude at a specific fault frequency across successive spectra may indicate the worsening of a defect. Below are some examples of waterfall charts.
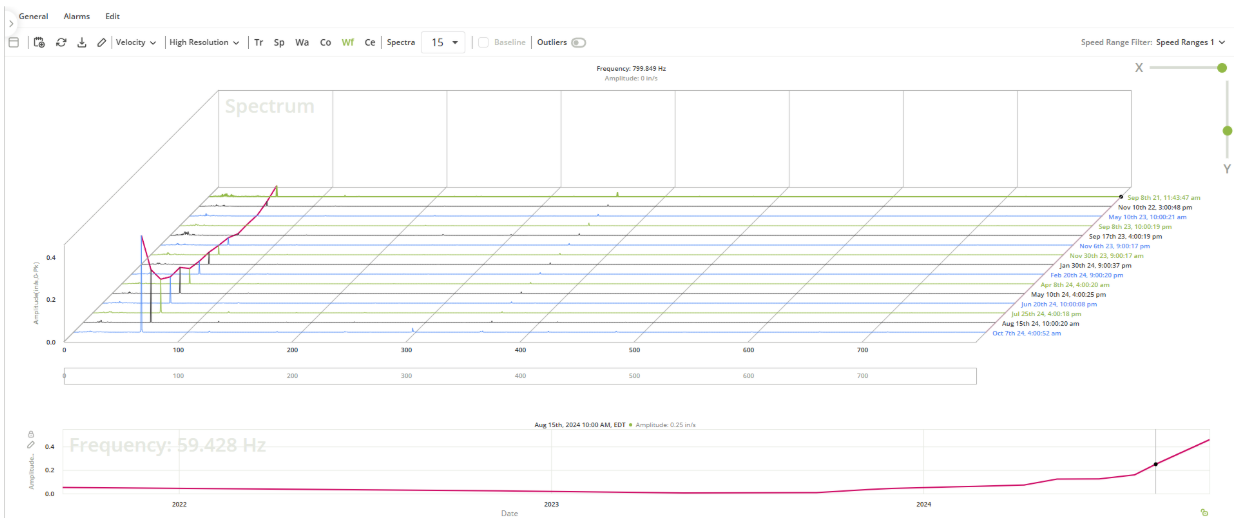
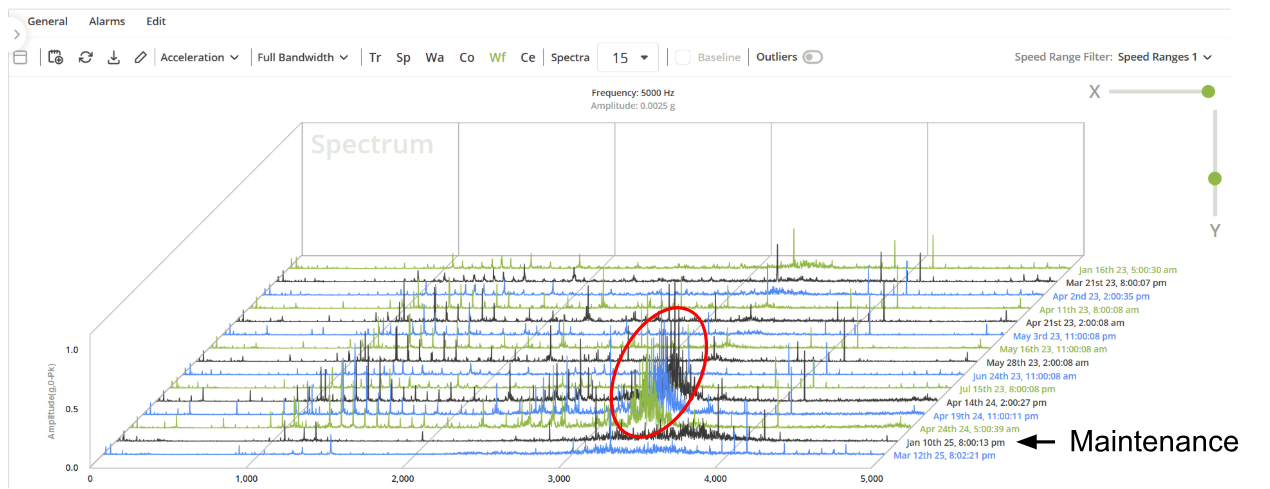
With this capability, users gain deeper insight into fault development and can take timely maintenance actions based on emerging trends in machine behavior.
Demodulation Analysis
Demodulation analysis, also known as demod or envelope analysis, is a powerful technique used in vibration analysis to detect localized faults such as bearing defects, gear tooth damage, and cracks. These faults often produce high-frequency impact signals that are difficult to identify using traditional vibration analysis methods. By applying demodulation analysis, these signals are extracted and amplified—making it easier to detect early-stage damage before it progresses into a severe failure. Below are some example demod spectrum plots indicating bearing issues.
The technique works by filtering out both low-frequency components related to machine operation and high-frequency noise that may mask fault signals. A band-pass filter is applied to isolate the frequency range where impact-related signals are expected. The filtered signal is then rectified and demodulated (enveloped) to extract the modulating frequencies, which often correspond to defect frequencies related to rolling element bearings, gear meshing, or structural resonances.
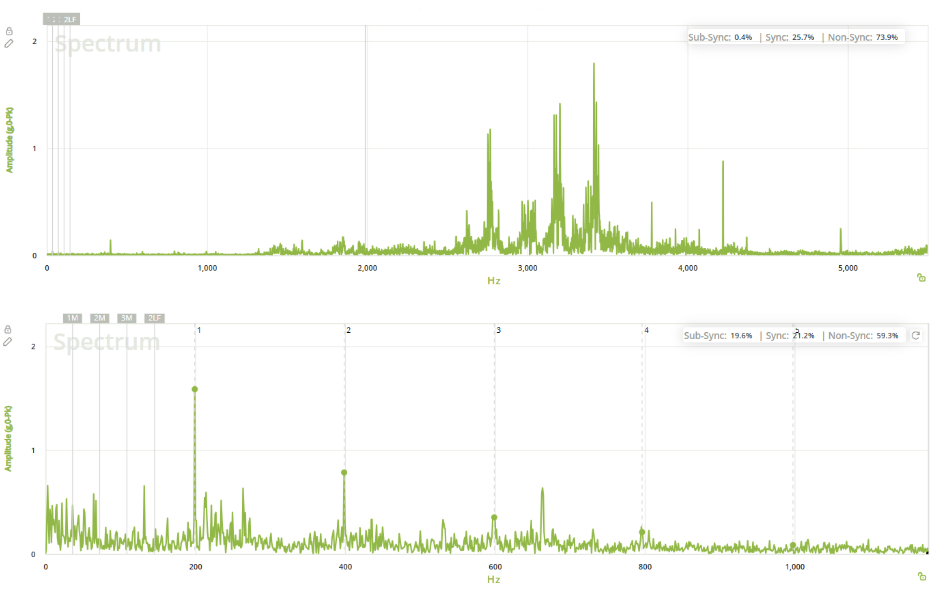
Bottom: Demodulated spectrum of the same data, showing clear fault frequency and harmonics.
Demodulation analysis is particularly useful in situations where direct spectral analysis may not reveal clear fault indicators due to noise, machine resonance, or masking effects. By enhancing the fault-related frequency components, it allows analysts to identify early-stage defects and take proactive maintenance actions.
Cepstrum Analysis
Cepstrum analysis is a powerful tool for detecting periodic structures within a frequency spectrum, making it particularly effective for diagnosing gearbox faults. By taking the inverse Fourier transform of the logarithm of the power spectrum, cepstrum analysis highlights periodic patterns that may be hidden in conventional spectral analysis. This is especially useful for identifying modulation effects caused by faults such as gear tooth wear, which introduce sidebands around gear meshing frequencies.
The logarithmic transformation enhances low-amplitude spectral components, allowing early-stage faults to be detected before they become severe. This technique is also valuable for detecting multiple faults simultaneously, as different modulation frequencies appear as distinct peaks in the quefrency (time-domain) domain.
Below are examples of cepstrum charts for gearboxes, illustrating how periodic structures and modulation effects manifest in real-world vibration data. By analyzing these patterns, analysts can diagnose faults more accurately, monitor their progression, and take proactive steps to optimize machine health.
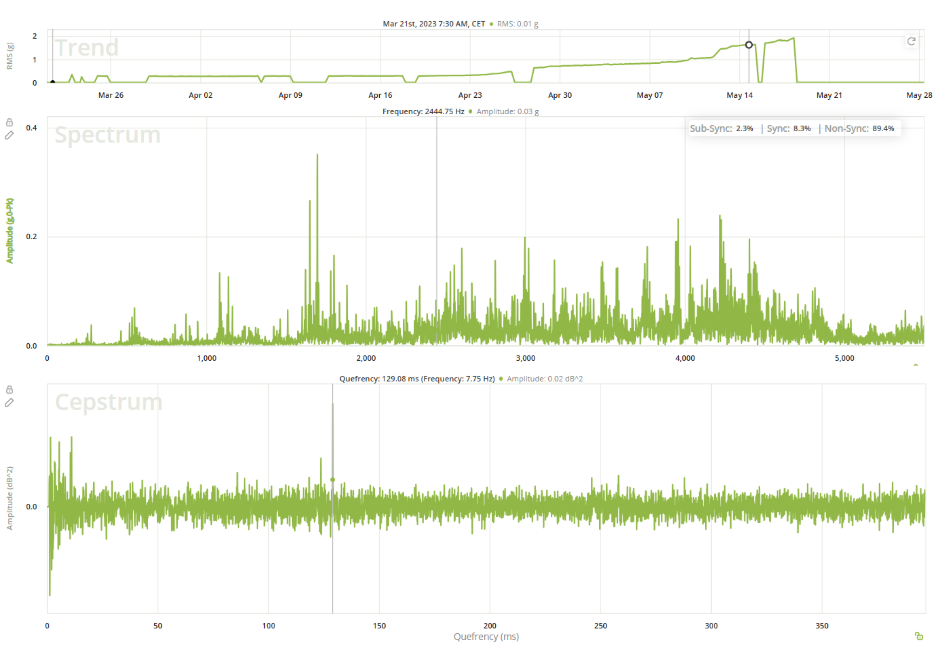
Middle: Vibration Spectrum (acceleration) is noisy and difficult to interpret.
Bottom: Cepstrum chart clearly shows that an issue is developing with a component at the 7.75 Hz frequency.
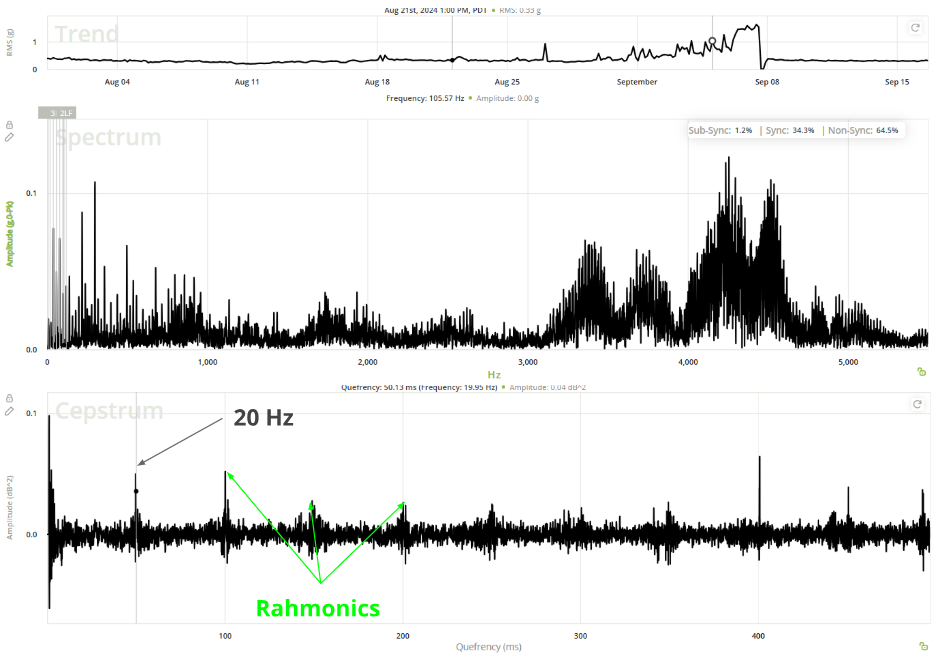
Middle: Vibration Spectrum (acceleration) is noisy and difficult to analyze.
Bottom: Cepstrum chart clearly shows that an issue is developing with a component at the 20 Hz frequency with rahmonics (harmonics of a cepstrum).
Conclusion
Petasense ARO provides a comprehensive suite of vibration analysis tools that empower analysts to detect, diagnose, and address machine faults with confidence. By integrating trend charts, waveform analysis, spectrum analysis, demodulation, and cepstrum analysis into a seamless workflow, the platform enables users to extract meaningful insights from vibration data and make informed maintenance decisions.
Each analysis technique offers unique benefits:
• Trend charts help track fault progression over time
• Waveform analysis aids in identifying transient or non-stationary events
• Spectrum analysis reveals characteristic fault frequencies
• Demodulation enhances early-stage fault detection
• Cepstrum analysis simplifies the identification of complex periodic faults
While all of these tools add value, trend charts, waveform analysis, and spectrum analysis represent the minimum required toolkit for effective fault detection and diagnosis. Anything less is insufficient for building a reliable condition monitoring program. Advanced techniques like demodulation and cepstrum analysis are powerful additions that provide deeper insight, especially in complex or early-stage fault scenarios.
Combined with the ability to configure alarms and customize monitoring settings, ARO equips users to proactively maintain critical assets and avoid unexpected failures, ultimately improving the reliability and efficiency of their operations.

 Thanks for subscribing - stay tuned for our next newsletter