JULY 21, 2023
Demystifying Condition Monitoring of VFD Driven Machines
AKASH SHRIVASTAVA, PDM DATA SCIENTIST @ PETASENSE
An Industry Driven by VFDs
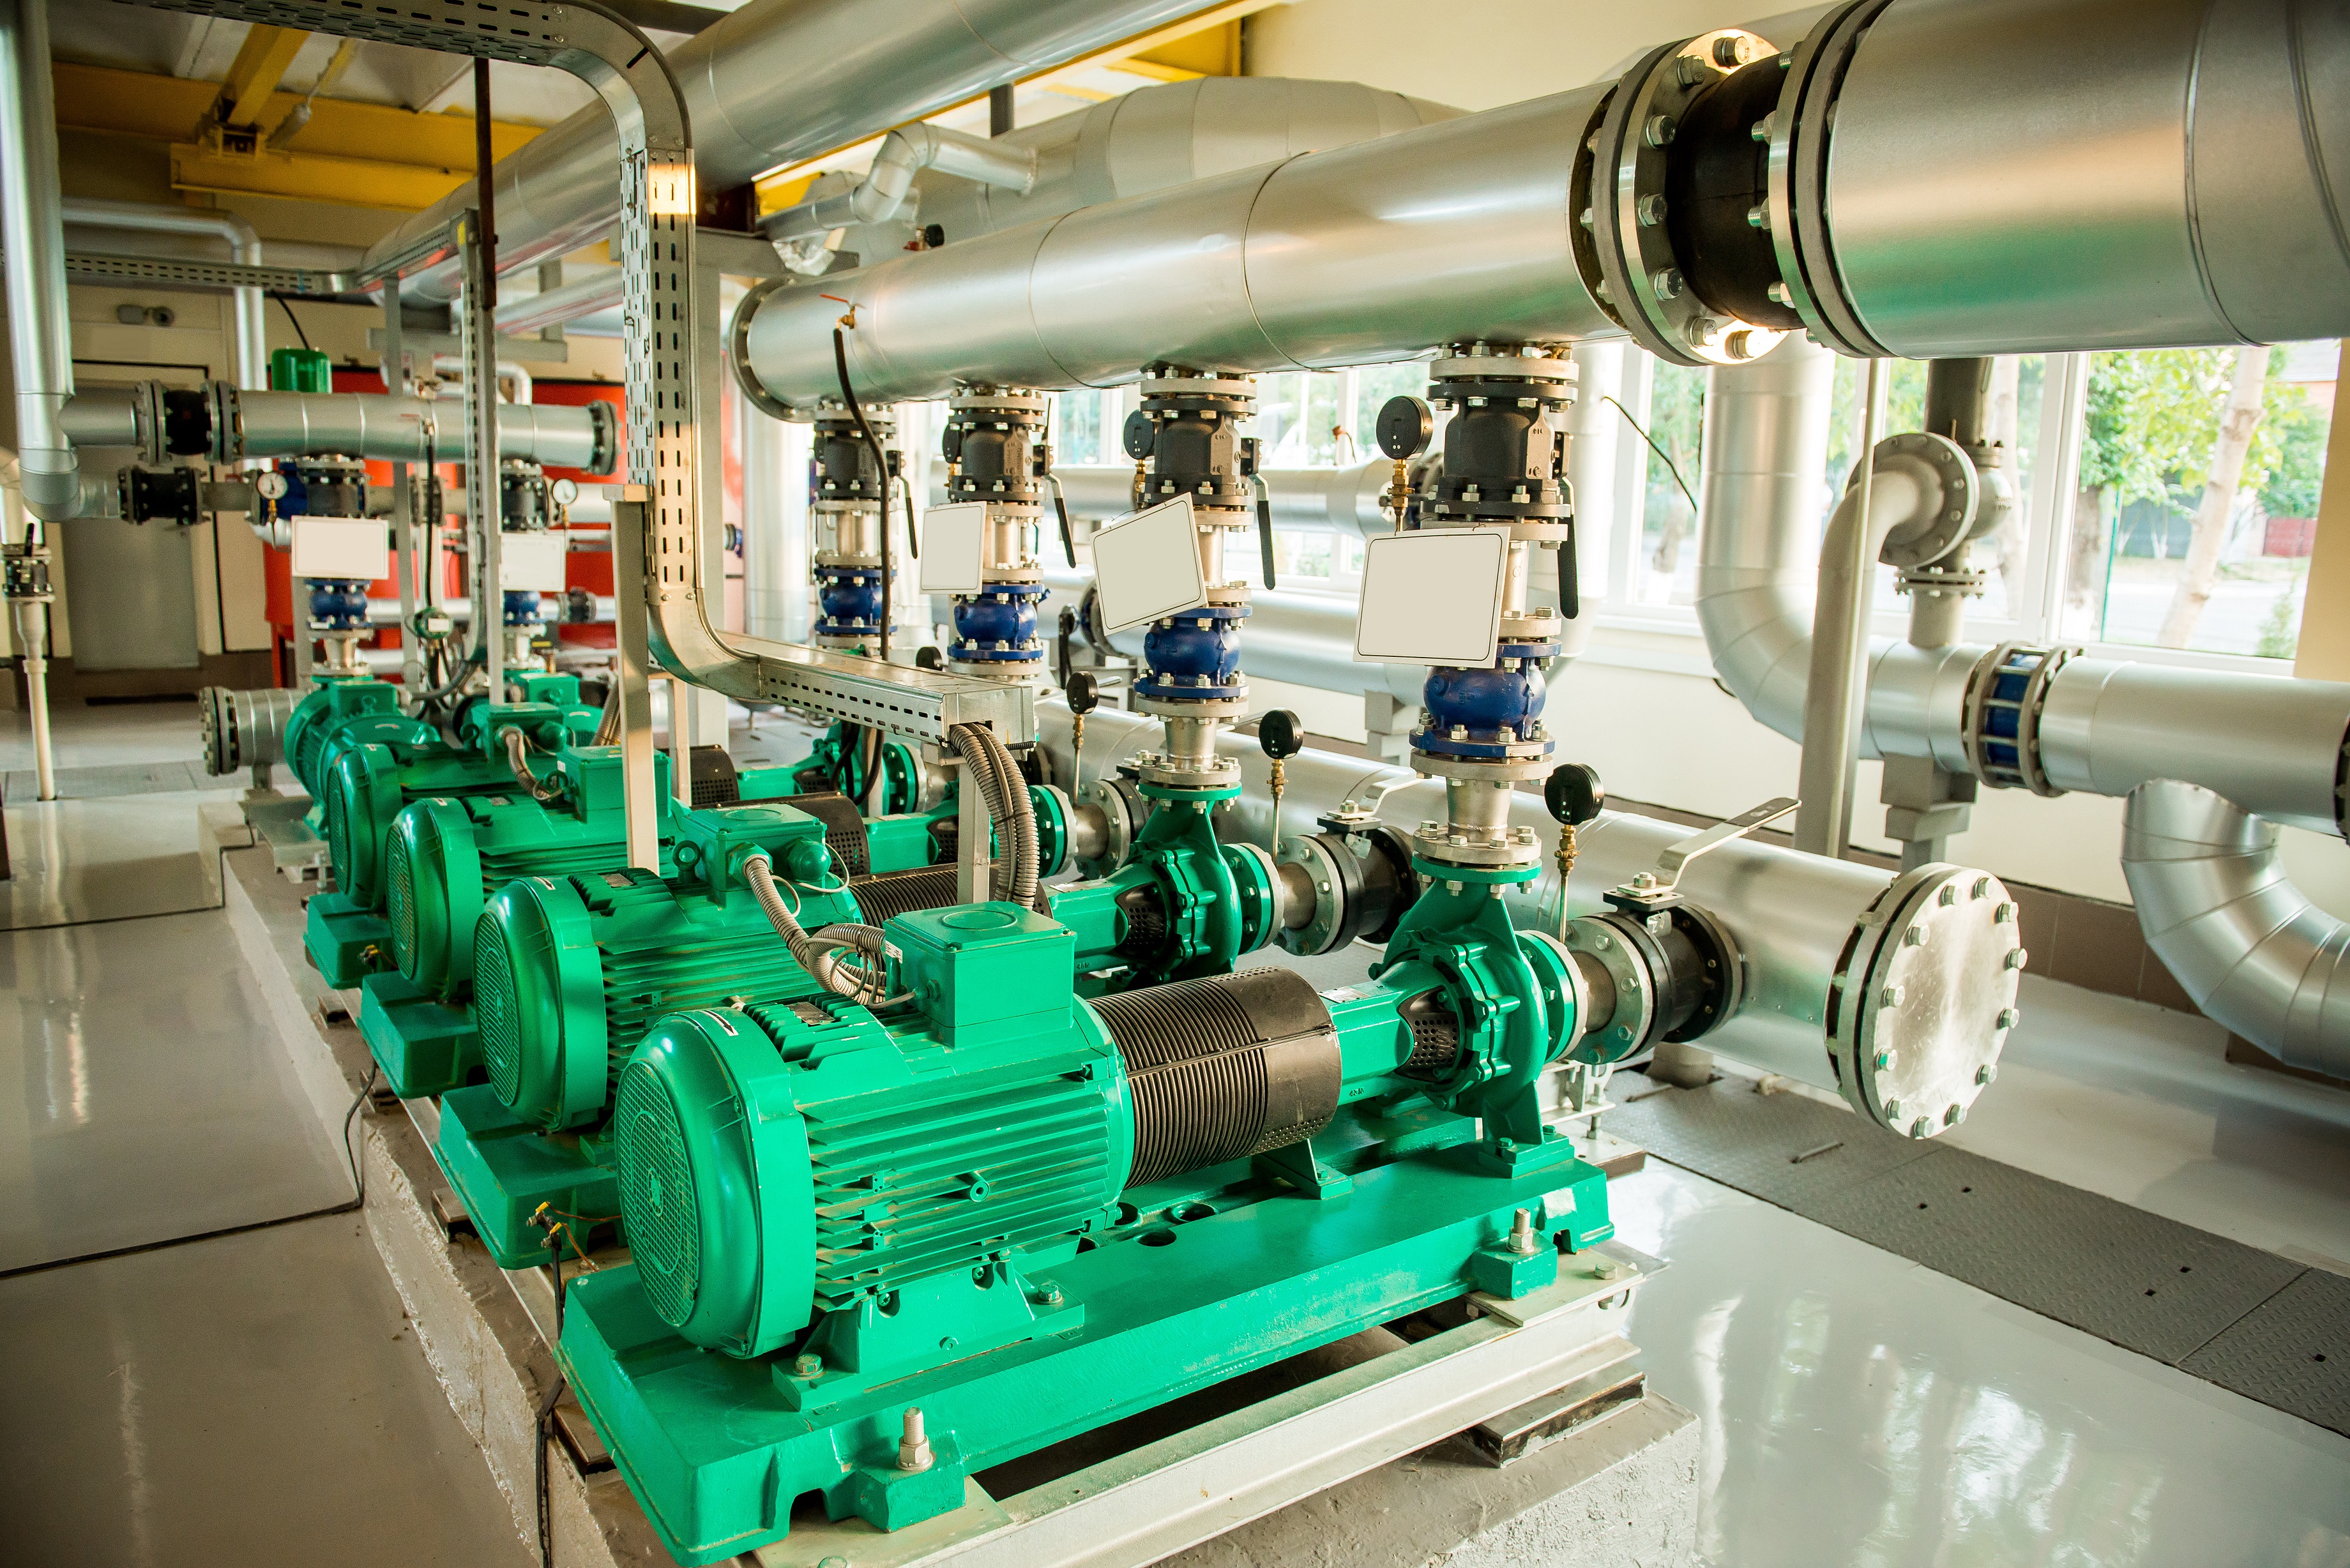
In recent years, the adoption of Variable Frequency Drive (VFD) technology has been rapidly increasing in industrial facilities around the world. Forced draft fans, water pumps and boiler feed pumps are some of the most common rotating machines where VFDs are utilized. Petasense, a provider of industrial predictive maintenance technologies, observes that an average of 40% of motors are controlled by VFDs across industries such as pharmaceuticals, power generation, utilities and mining. As the demand for energy-efficient solutions continues to rise, it is anticipated that the percentage of VFD-controlled motors will also continue to increase. According to a recent study by Grandview Research, the global VFD market size is expected to grow at 5.6% of compound annual growth rate from 2023-2030 (Variable Frequency Drive Market Size & Share Report, 2023).
While Variable Frequency Drives (VFDs) have undoubtedly revolutionized motor control by offering energy-saving benefits and enhanced operational efficiency, their implementation presents unique challenges when it comes to asset reliability and condition monitoring. One of the major hurdles comes from the variability in the captured signal from measurement to measurement. It becomes virtually impossible to trend data, such as vibration, across multiple measurements due to the fluctuations in speed or load. These fluctuations in motor operation can lead to variations in the amplitude, frequency content, and spectral characteristics of the signals. This poses a challenge for analysts and condition monitoring systems that generally rely on consistent signal patterns to compare measurements and accurately identify equipment faults.
Understanding the Behavior of VFD Operated Machines
Constant speed machines maintain a fixed rotational speed throughout their operation. Since the speed remains unchanged, the vibration pattern of these machines is typically more consistent and predictable. The vibration spectrum of a constant speed machine often exhibits distinct and narrow peaks, corresponding to the fundamental rotational frequency and its harmonics.
On the other hand, VFDs control the frequency and voltage supplied to a motor, enabling precise speed regulation. As a result, these machines often exhibit varying vibration signatures, primarily influenced by the speed settings. When the motor speed changes, vibration frequency and amplitude also tend to fluctuate accordingly.
The input power and frequency from VFDs to AC induction motors affect the machine vibration in following ways:
a. Vibration amplification due to resonance:
Changes in operating speed by a VFD may excite a system’s resonant frequencies, which can lead to increased vibration. In modern VFDs, built-in skip frequencies and bandwidth parameters are available that enable users to avoid problematic speed bands within operating range.
b. Vibration due to increased harmonic distortion:
As VFDs introduce harmonic distortion in the current supplied to the motors, these additional harmonics may result in mechanical vibration. Resonance can further amplify the vibration when harmonics fall close to natural frequencies in the vibration spectrum.
c. Torque pulsation:
VFDs may cause torque fluctuations in motors and driven machine components. Machine component failure has been reported countless times due to excessive torque pulsation caused by torsional resonance when harmonics are matched with torsional resonant frequency. It is worth mentioning that the accelerometers or proximity probes do not detect torsional vibration, hence, techniques like electrical signature analysis or torque measurement are required to capture torsional vibration.
Challenges with Vibration Analysis of VFD Driven Machines
One significant challenge in analyzing vibration data from VFD machines is the absence of speed measurements. Without accurate speed information, it becomes difficult to identify the forcing frequencies accurately. Many frequencies, including synchronous and non-synchronous vibrations, are dependent on the operating speed of the machine.
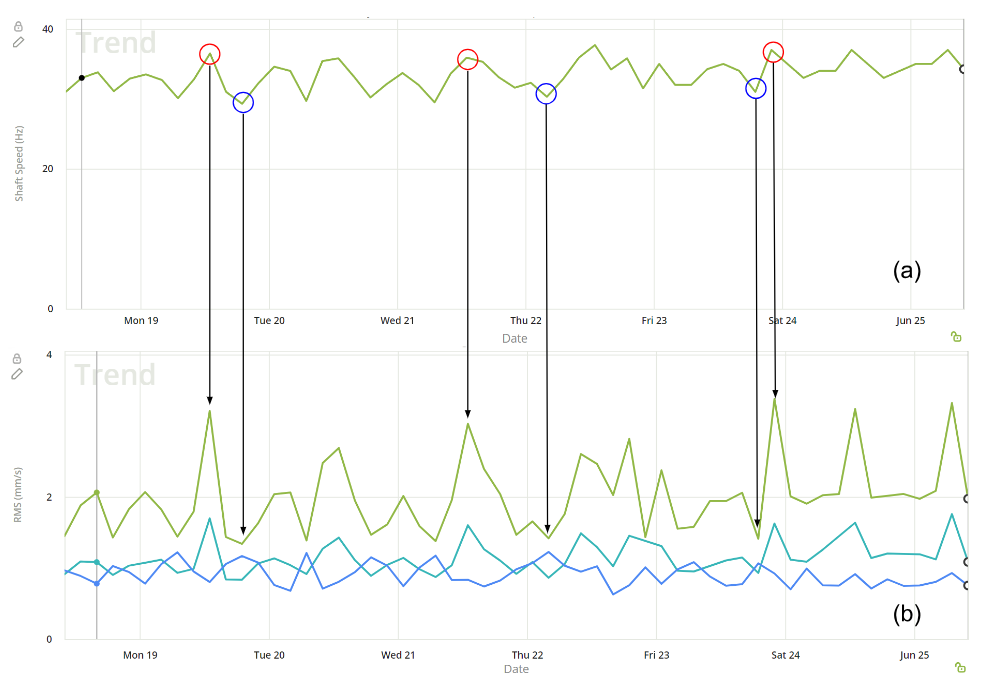
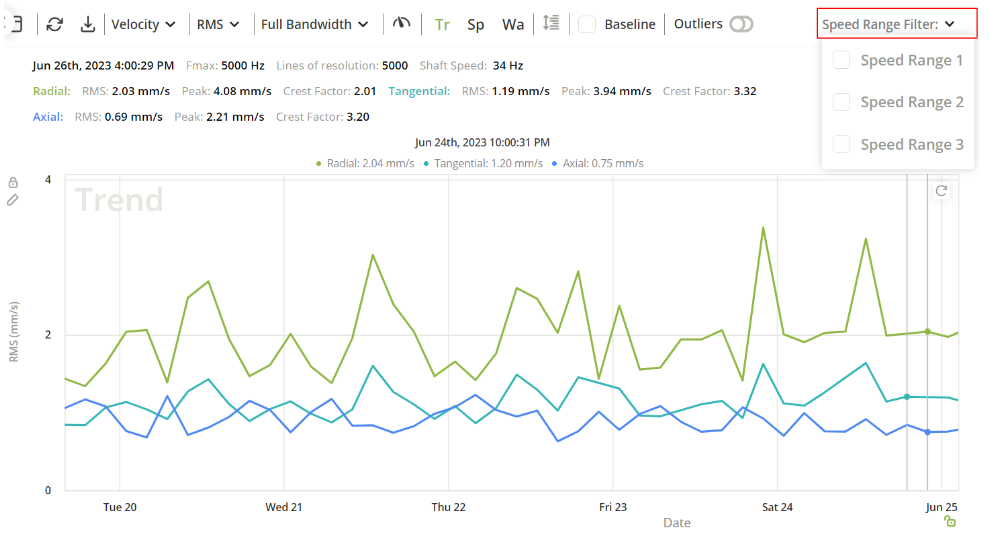
As the operating speed of a VFD machine changes, it directly impacts the vibration characteristics. Different speeds introduce variations in the dynamic behavior of the machine, resulting in vibration level fluctuations and alterations in vibration patterns. These fluctuations and pattern changes make it difficult to establish consistent trends and identify underlying vibration issues accurately. As an example, Figure 1 (below) illustrates the dynamic nature of an Air Handling Unit (AHU) motor’s speed, presenting a fluctuating pattern of running speed and vibration over the recorded time period.
There are other challenges when it comes to the analysis of vibration data from VFD machines such as smearing, which is encountered with vibration measurements in the presence of speed fluctuations. When the speed of a machine fluctuates during the measurement process, the resulting spectra may not accurately represent clear frequencies and amplitudes of vibration components.
Proven Solutions
Overcoming the previously mentioned challenges requires innovative techniques, ample data availability and a deep understanding of the machine’s dynamics to accurately diagnose and mitigate faults in VFD machines. As a solution, some industrial sensor providers have begun incorporating multi-parameter sensing and specialized signal processing techniques to account for the effects of VFDs on condition monitoring.
1. Integrating vibration and speed data:
Integrating vibration and speed measurements involves combining data from both vibration sensors and speed sensors to gain a comprehensive understanding of machine performance. For example, The Vibration Mote Model 3 from Petasense combines a vibration sensor, temperature sensor and magnetic flux sensor in one device to capture machine condition and operating speed simultaneously. Vibration analysis helps detect and diagnose faults and abnormalities in a machine’s operation, while the magnetic flux data from the motor provides crucial information about the machine’s rotational speed to help analyze the vibration data more effectively. By integrating these two measurements, analysts can correlate vibration patterns with specific operating conditions, such as changes in speed, and gain insights into the relationship between machine performance and vibration characteristics. An alternative way to accomplish multi-parameter sensing is to integrate a vibration monitoring system with existing operational data historian software. Many modern condition monitoring solutions offer APIs and integration tools to leverage existing data from process historians, such as the Aveva PI system.
2. Speed detection with advanced sensors:
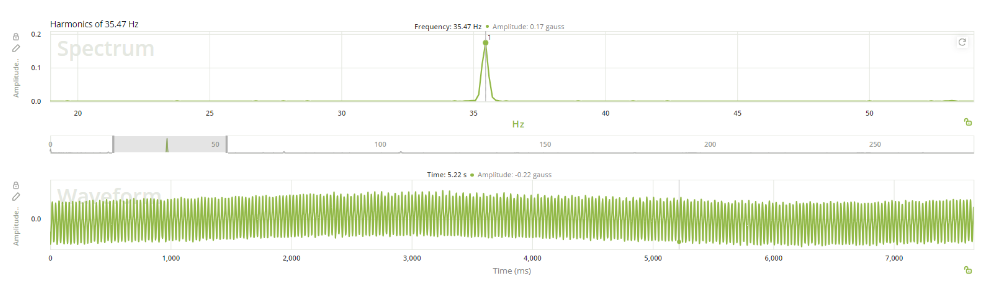
Speed detection in VFD (Variable Frequency Drive) machines is essential for accurate vibration analysis. For example, magnetometer-based speed detection utilizes magnetic field changes induced by rotating components to determine speed.
3. Speed-based trend analysis
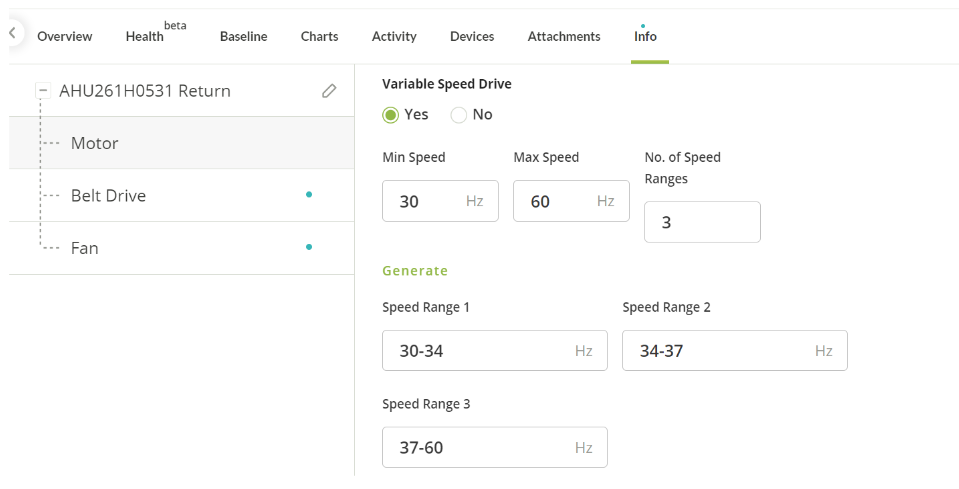
Speed-based trend analysis involves tracking and analyzing vibration data in relation to changes in machine speed over time. By monitoring vibration levels at different speed intervals, one can identify trends and patterns that may indicate developing faults or degradation in the machine’s condition. This approach allows for the detection of speed-related vibration issues, such as resonances or imbalance, which may be more pronounced or occur within specific speed ranges. By establishing baseline vibration profiles at different speeds, analysts can establish alarms or thresholds to detect deviations from normal behavior and initiate proactive maintenance actions before significant failures occur.
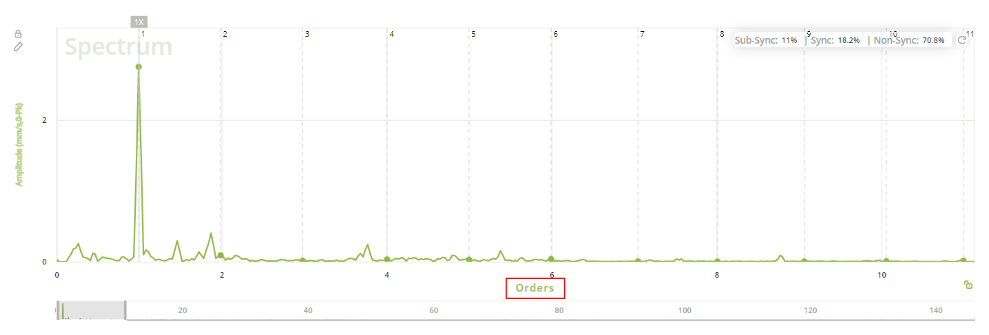
With the availability of speed data, vibration spectra can be presented in order scale, where frequencies are speed normalized. This option greatly helps with visualizing and analyzing vibration data recorded at different speed conditions.
Closing Thoughts
In summary, integrating vibration and speed measurement enables a more comprehensive analysis of VFD driven machine behavior. Speed detection with advanced sensors provides accurate speed data for precise monitoring, while speed-based trend analysis allows for the identification of speed-induced vibration issues and facilitates proactive maintenance strategies. Furthermore, it is crucial to establish comprehensive baseline data and reference measurements that consider the variability associated with VFD-controlled motors. By understanding a machine’s normal operating behavior under varying load conditions, it becomes easy to differentiate between normal variations and abnormal patterns caused by actual faults. This integrated approach greatly enhances the ability to perform predictive maintenance and addresses the various complexities around condition monitoring of VFD driven machines.
Want to learn more? Contact sales@petasense.com to request a free consultation with one of our experts.

 Thanks for subscribing - stay tuned for our next newsletter